Why Develop Drone-based Technology for Rail Crossing Assessment?
In 2018, the FRA reported 2,214 total Highway-Rail incidents that led to 270 fatalities (1). Portion of these incidents are caused by inappropriate vertical design or inadequate sight distance triangles. Conditions where vehicles can become stuck on the highway-rail grade crossing are especially of concern. There are numerous examples, such as the 2017 incident in Biloxi, MS, where a motor coach that became stuck on a humped crossing was struck by a freight train, resulting in four deaths and 37 injuries (2).
System Development
There are over 200,000 highway-rail grade crossings in the United States. Some of them do not meet the various design guidelines, potentially presenting a risk to motor vehicles crossing the tracks. The FRA has funded research through the Small Business Innovation Research (SBIR) program to promote development of advanced technologies with potential to improve safety at the grade crossings.
This project funded MTRI Inc. of Michigan with partner Michigan Technological University to develop and demonstrate the Crossing-i System, an Automated, Drone-Based Grade Crossing Inspection System. The prototype system can determine whether vertical approach grades create a risk for vehicles to get stuck on tracks, assess adequacy of visual sight lines at the crossing, and locate relevant assets such as gates, lights, signage, etc. It uses high-resolution images collected via drone / unmanned aerial system that are the processed into 3D data for analysis. The system can also use other high quality 3D data sources provided by other systems to complete the crossing analysis. The system can also use other high quality 3D data sources provided by other systems to complete the crossing analysis. A report on Phase I of the SBIR project is available at https://railroads.dot.gov/elibrary/automated-drone-based-inspection-system
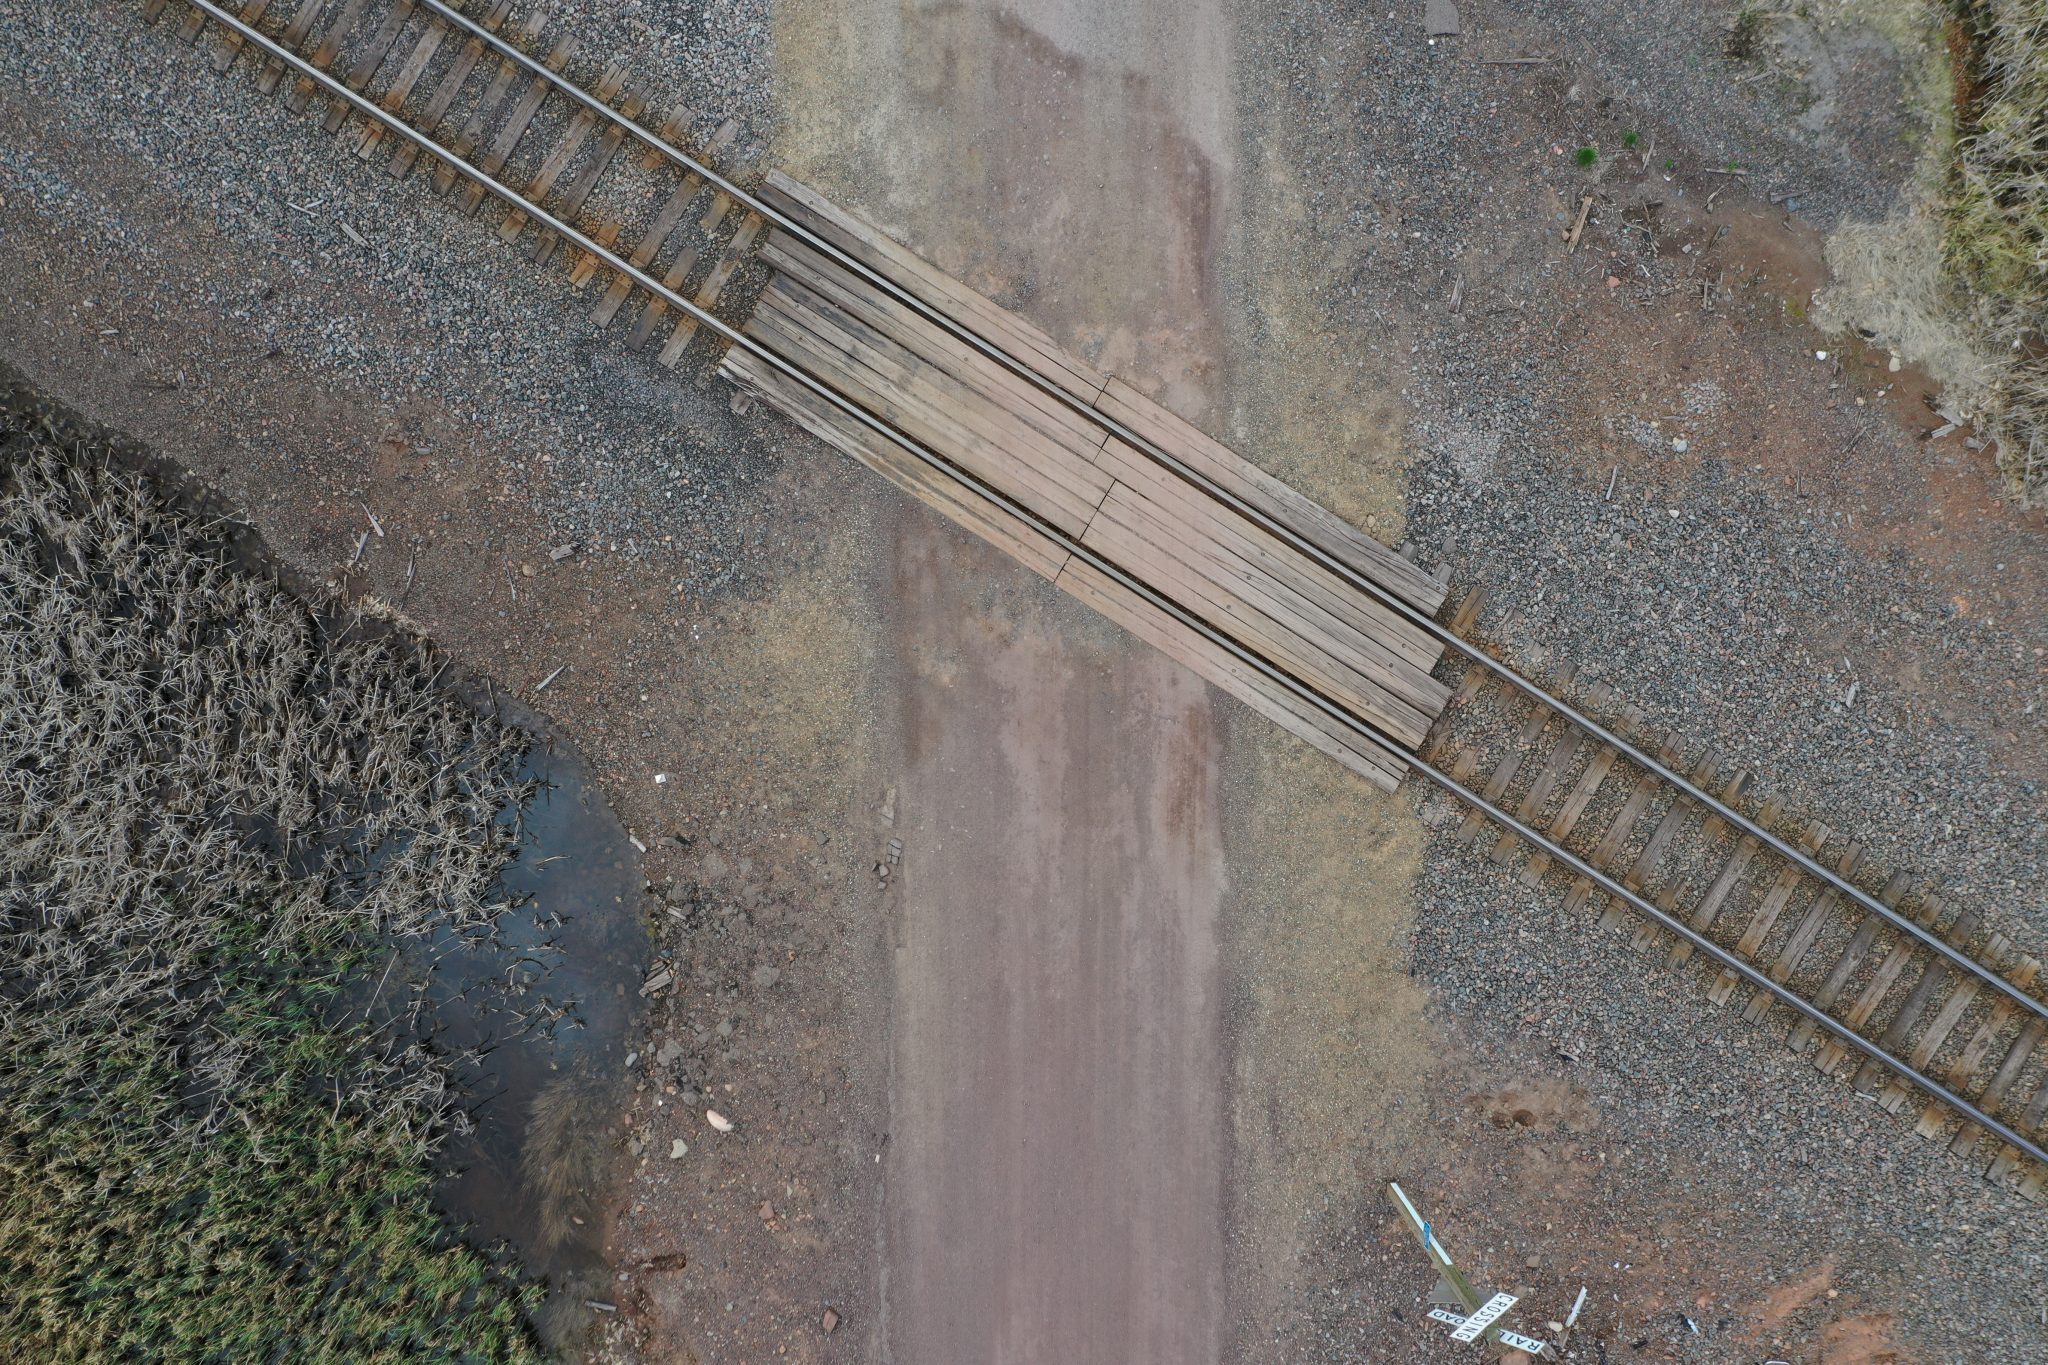
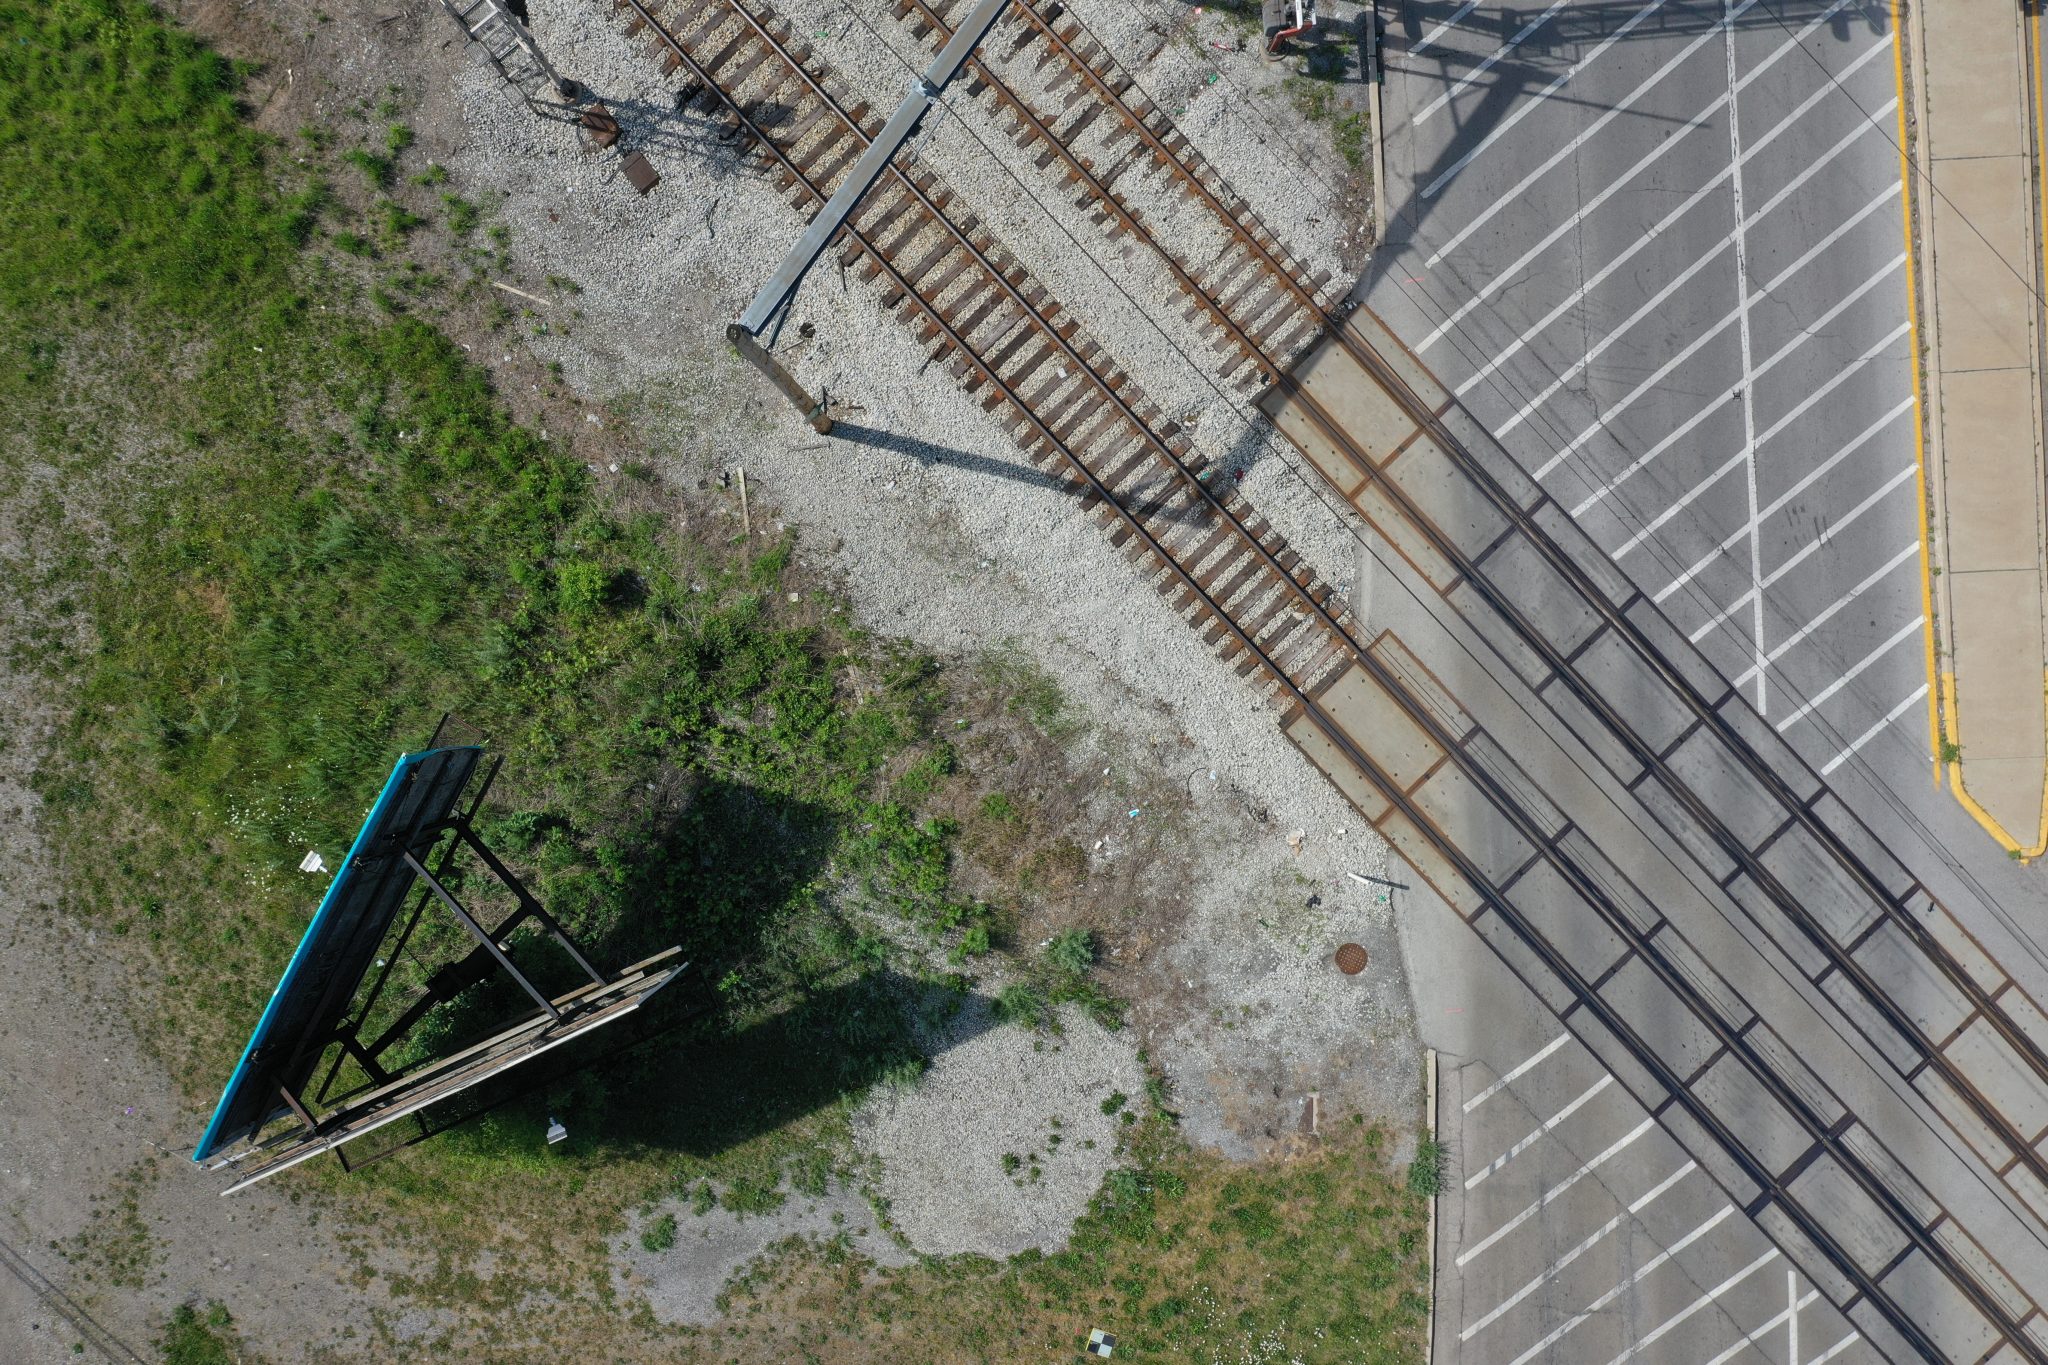
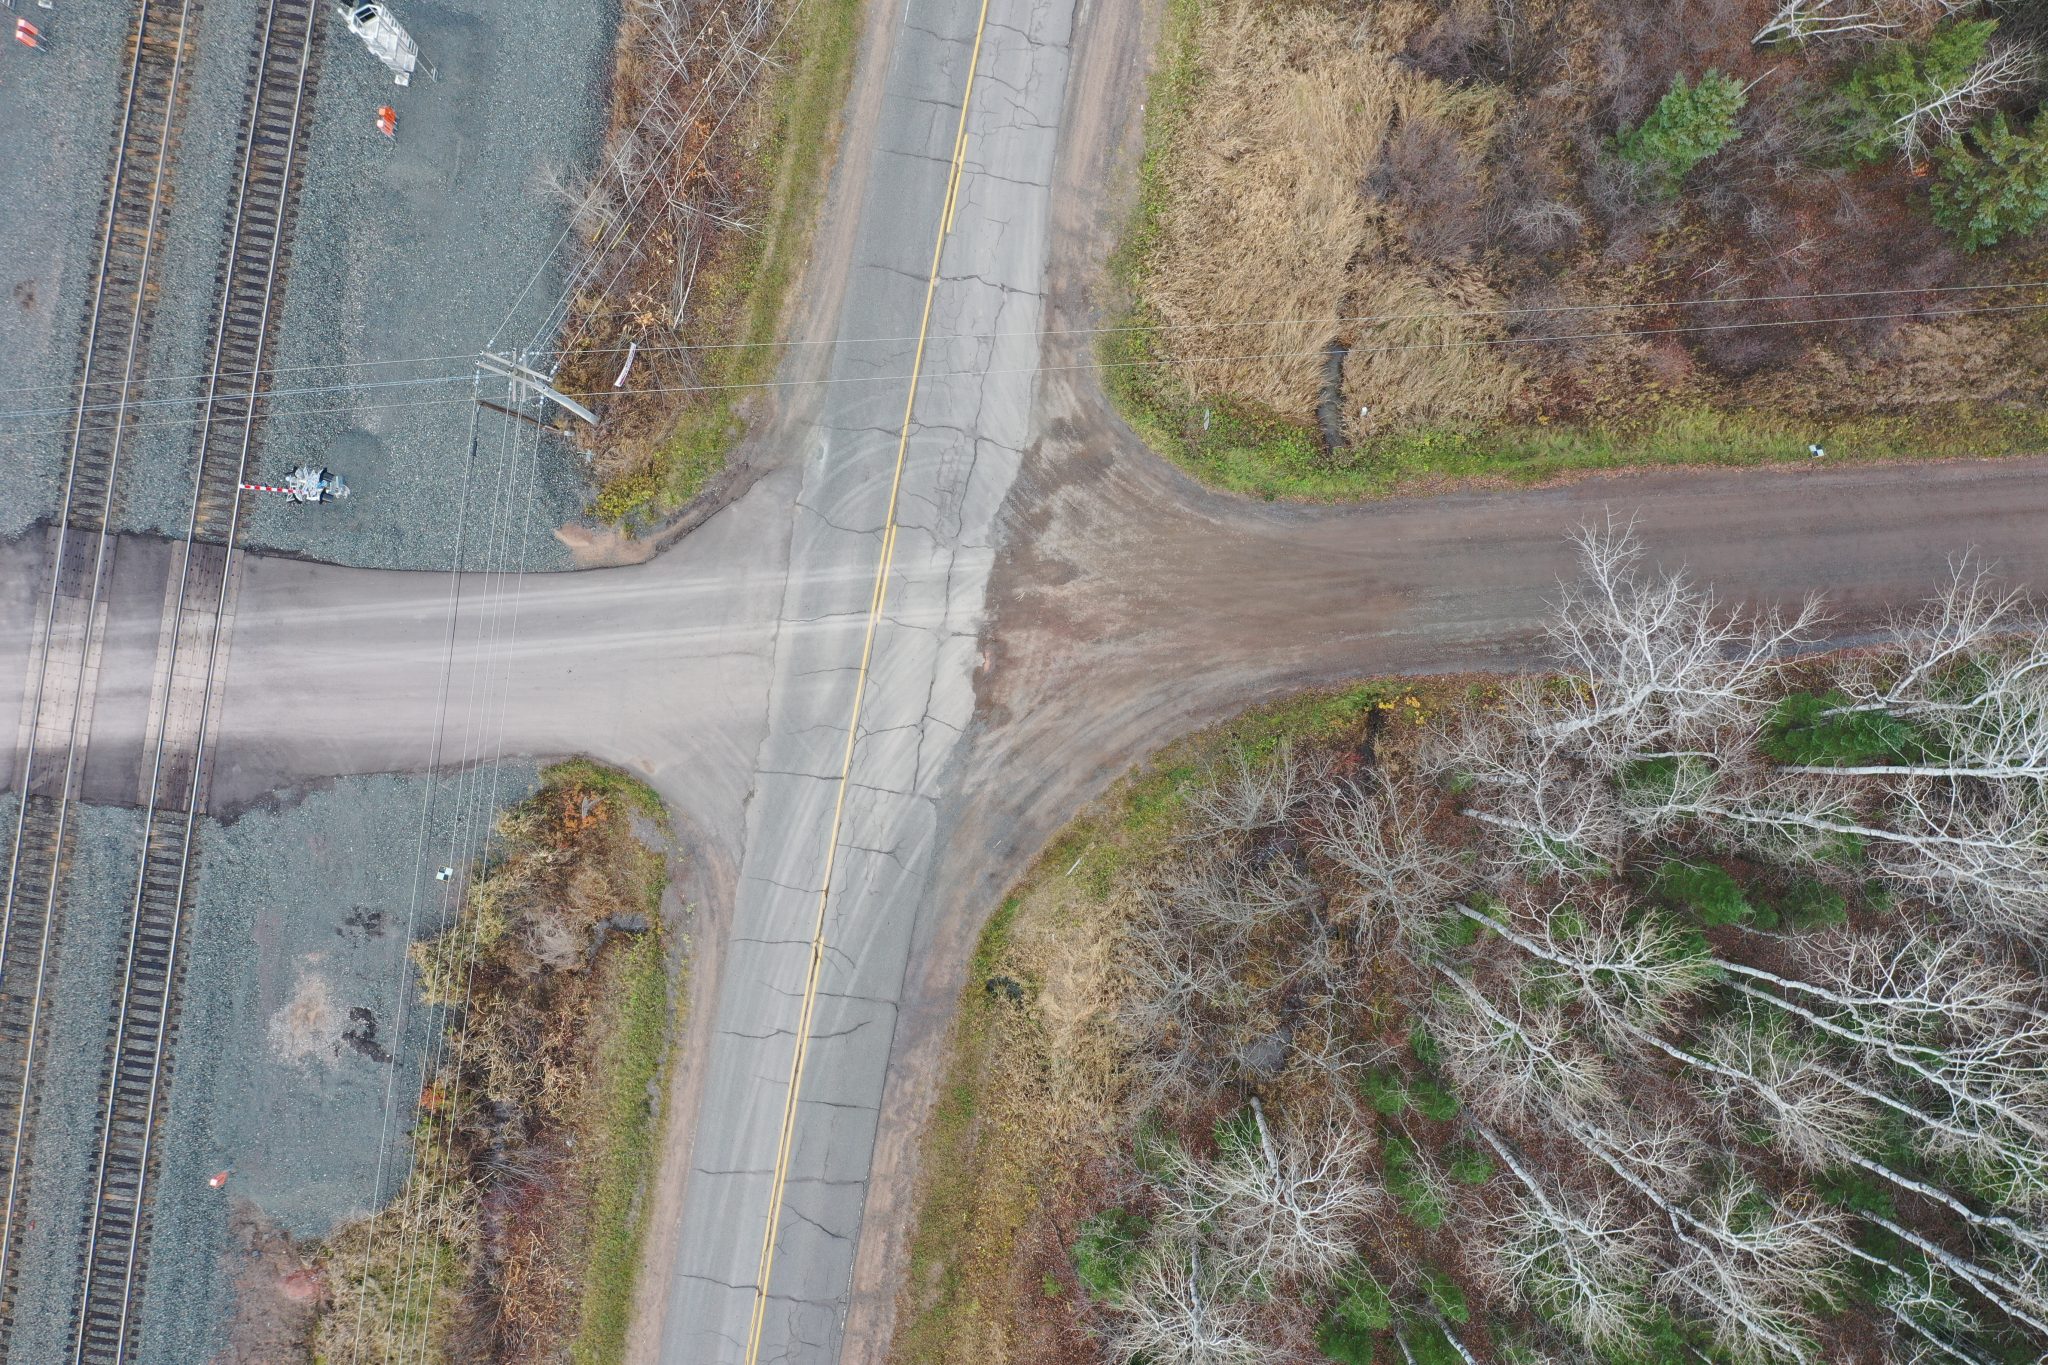
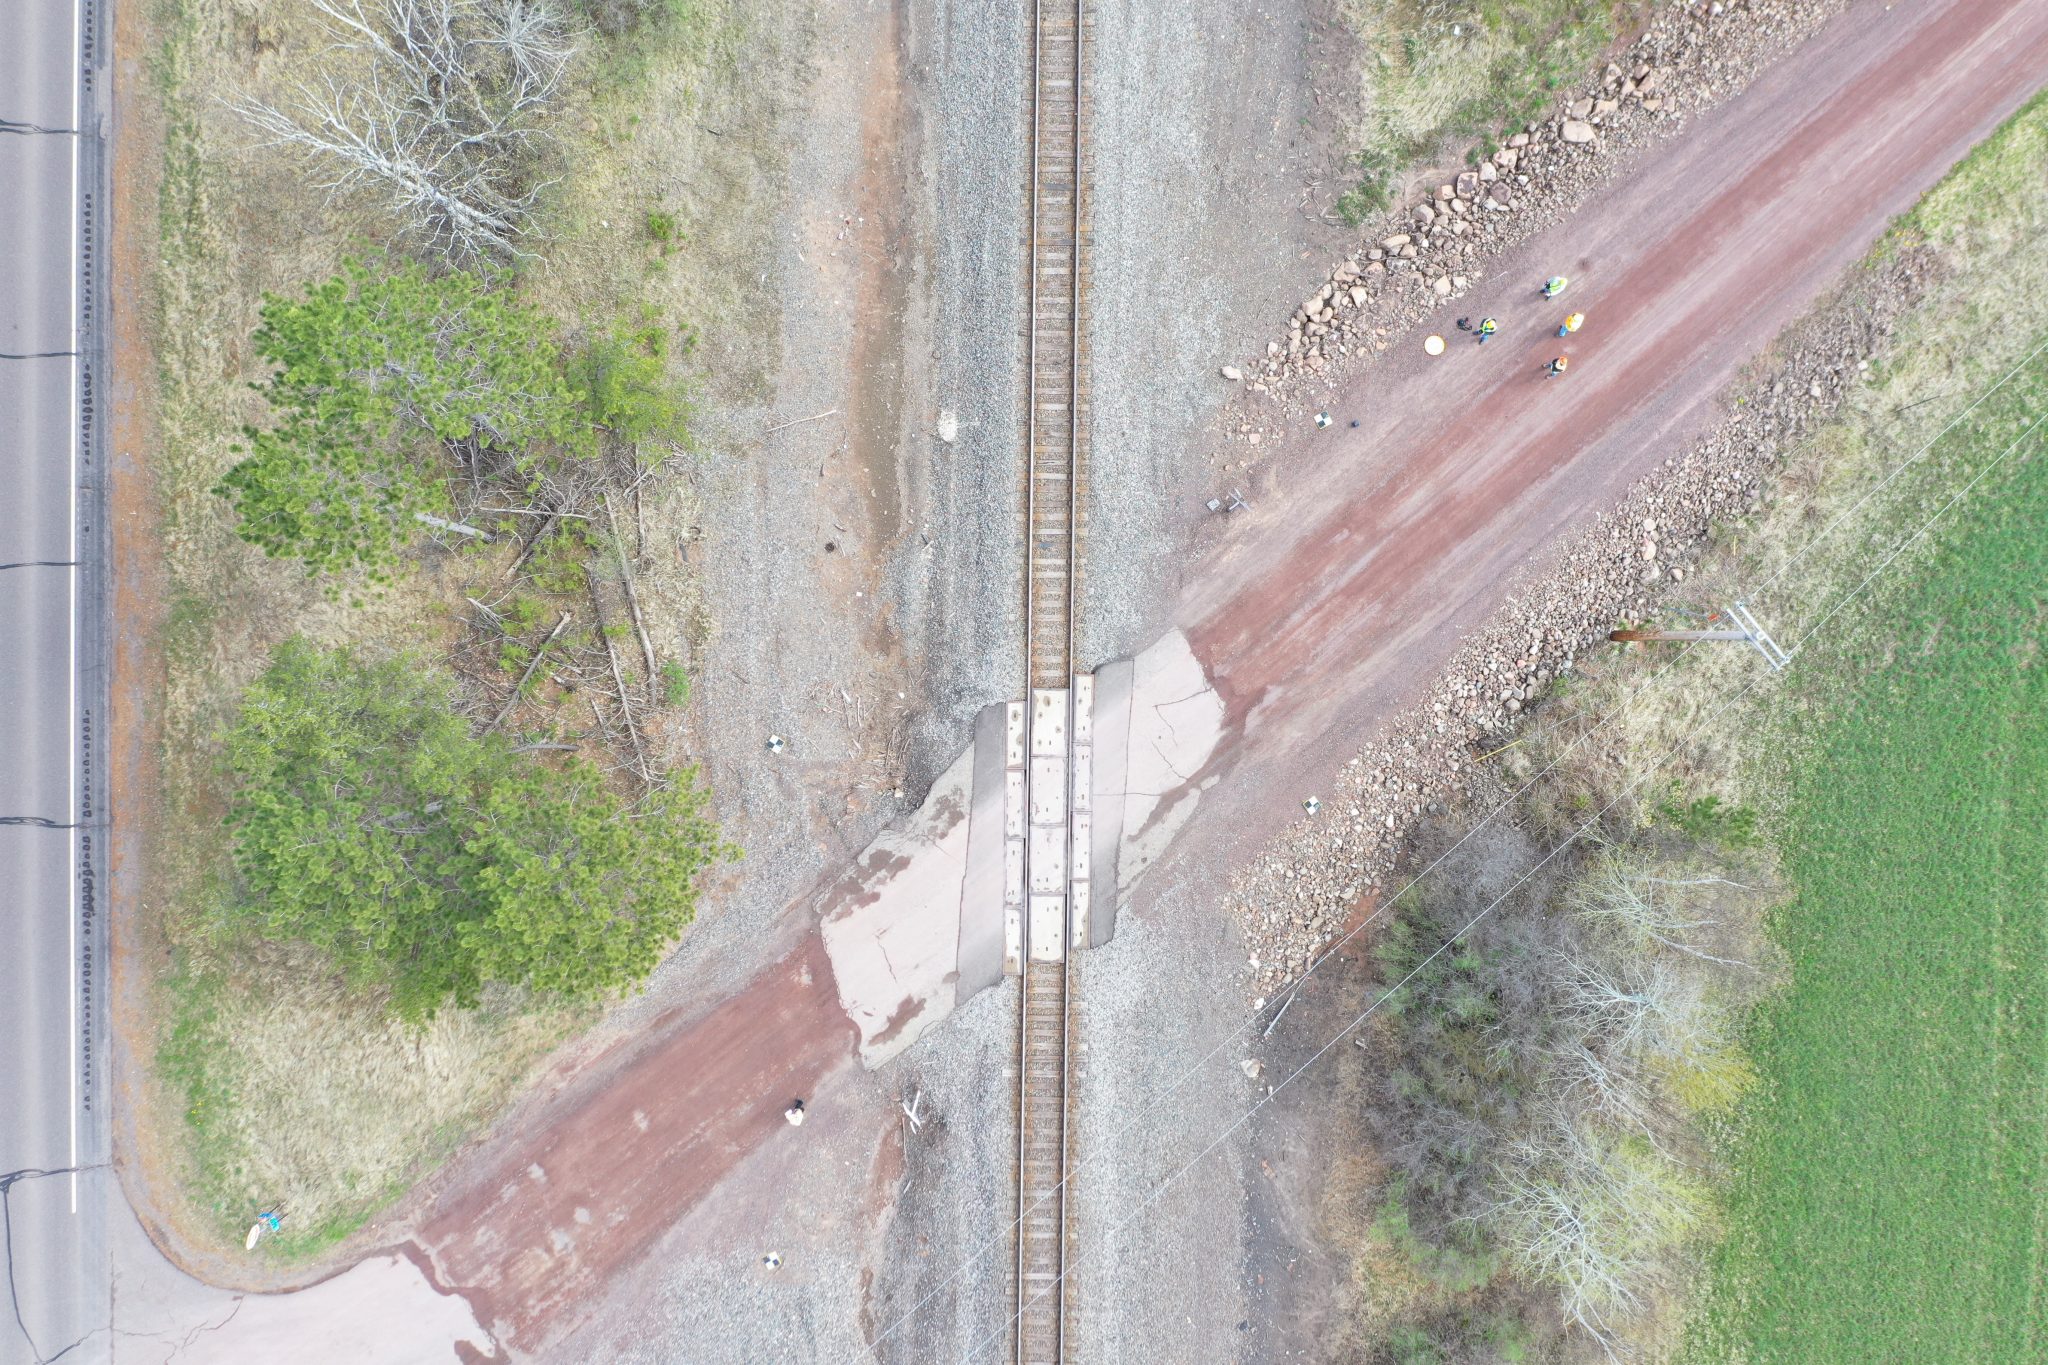
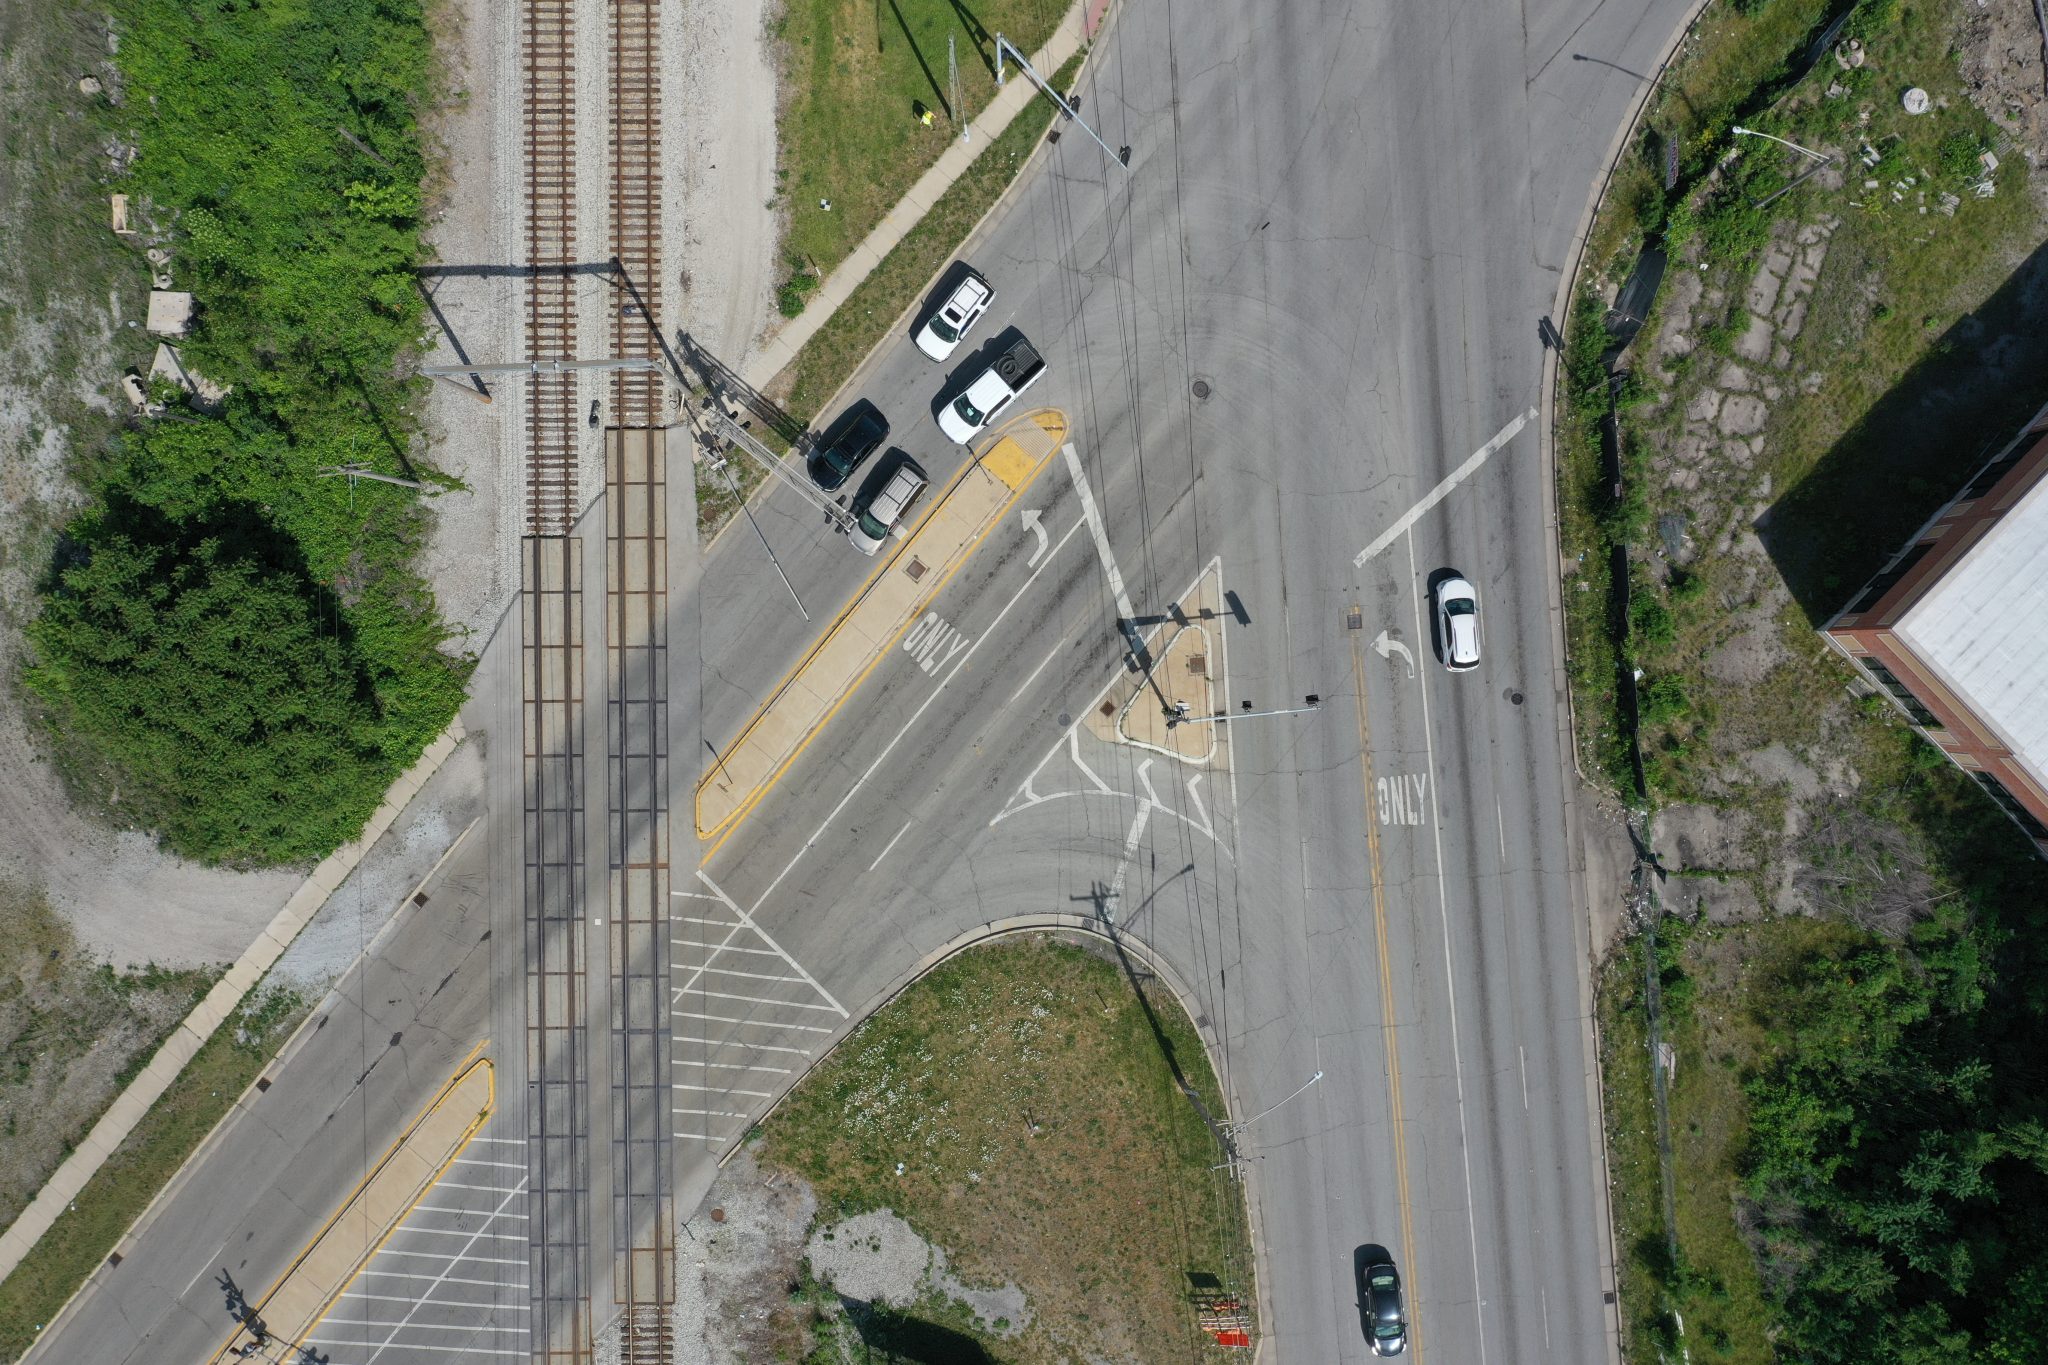
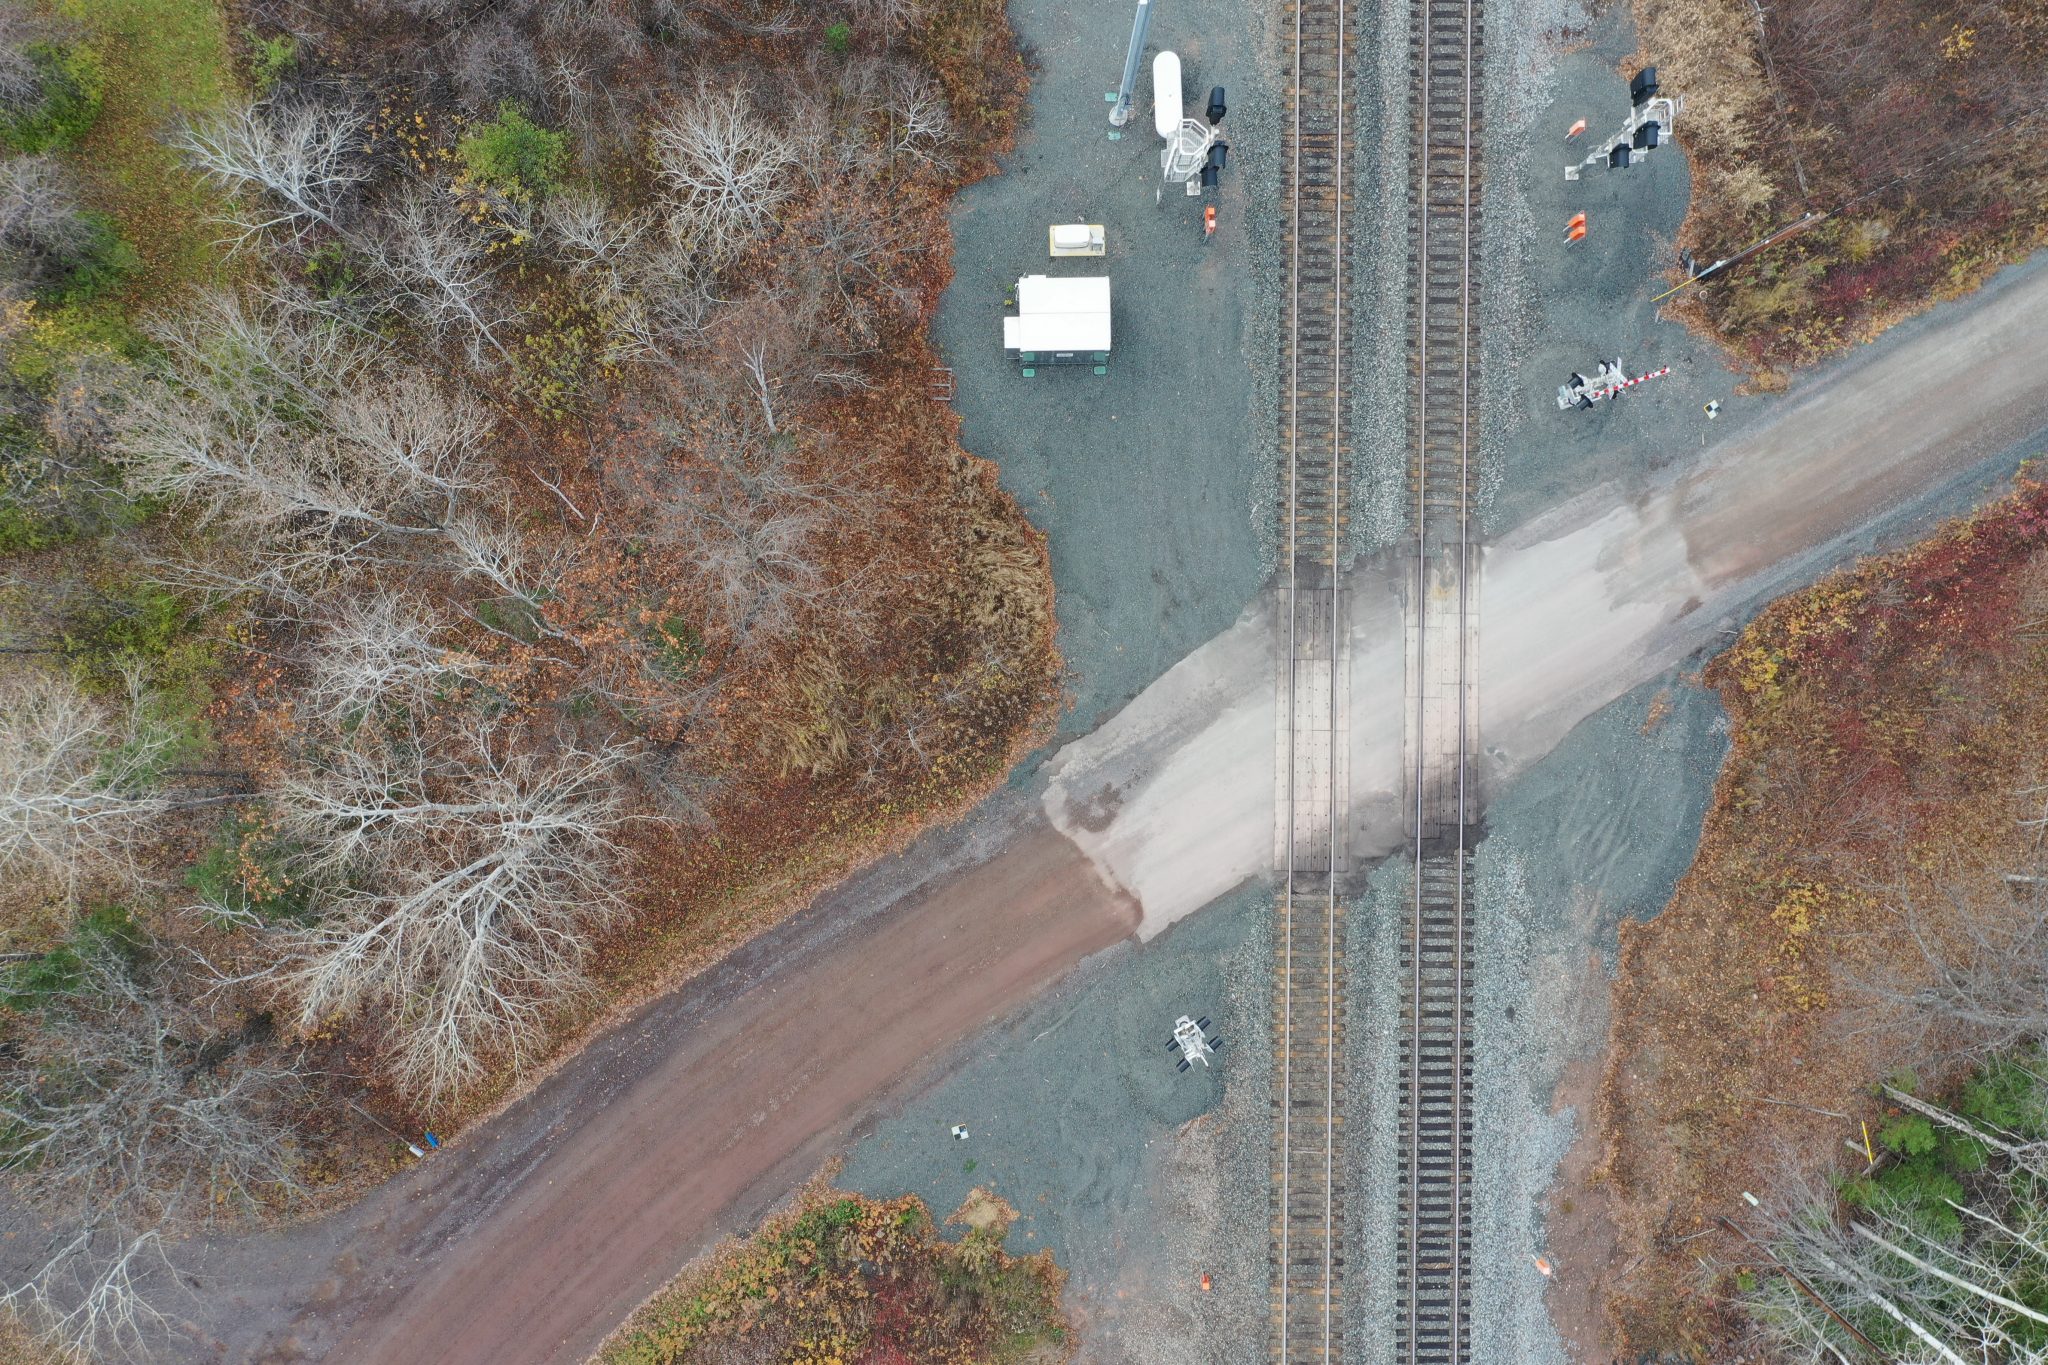
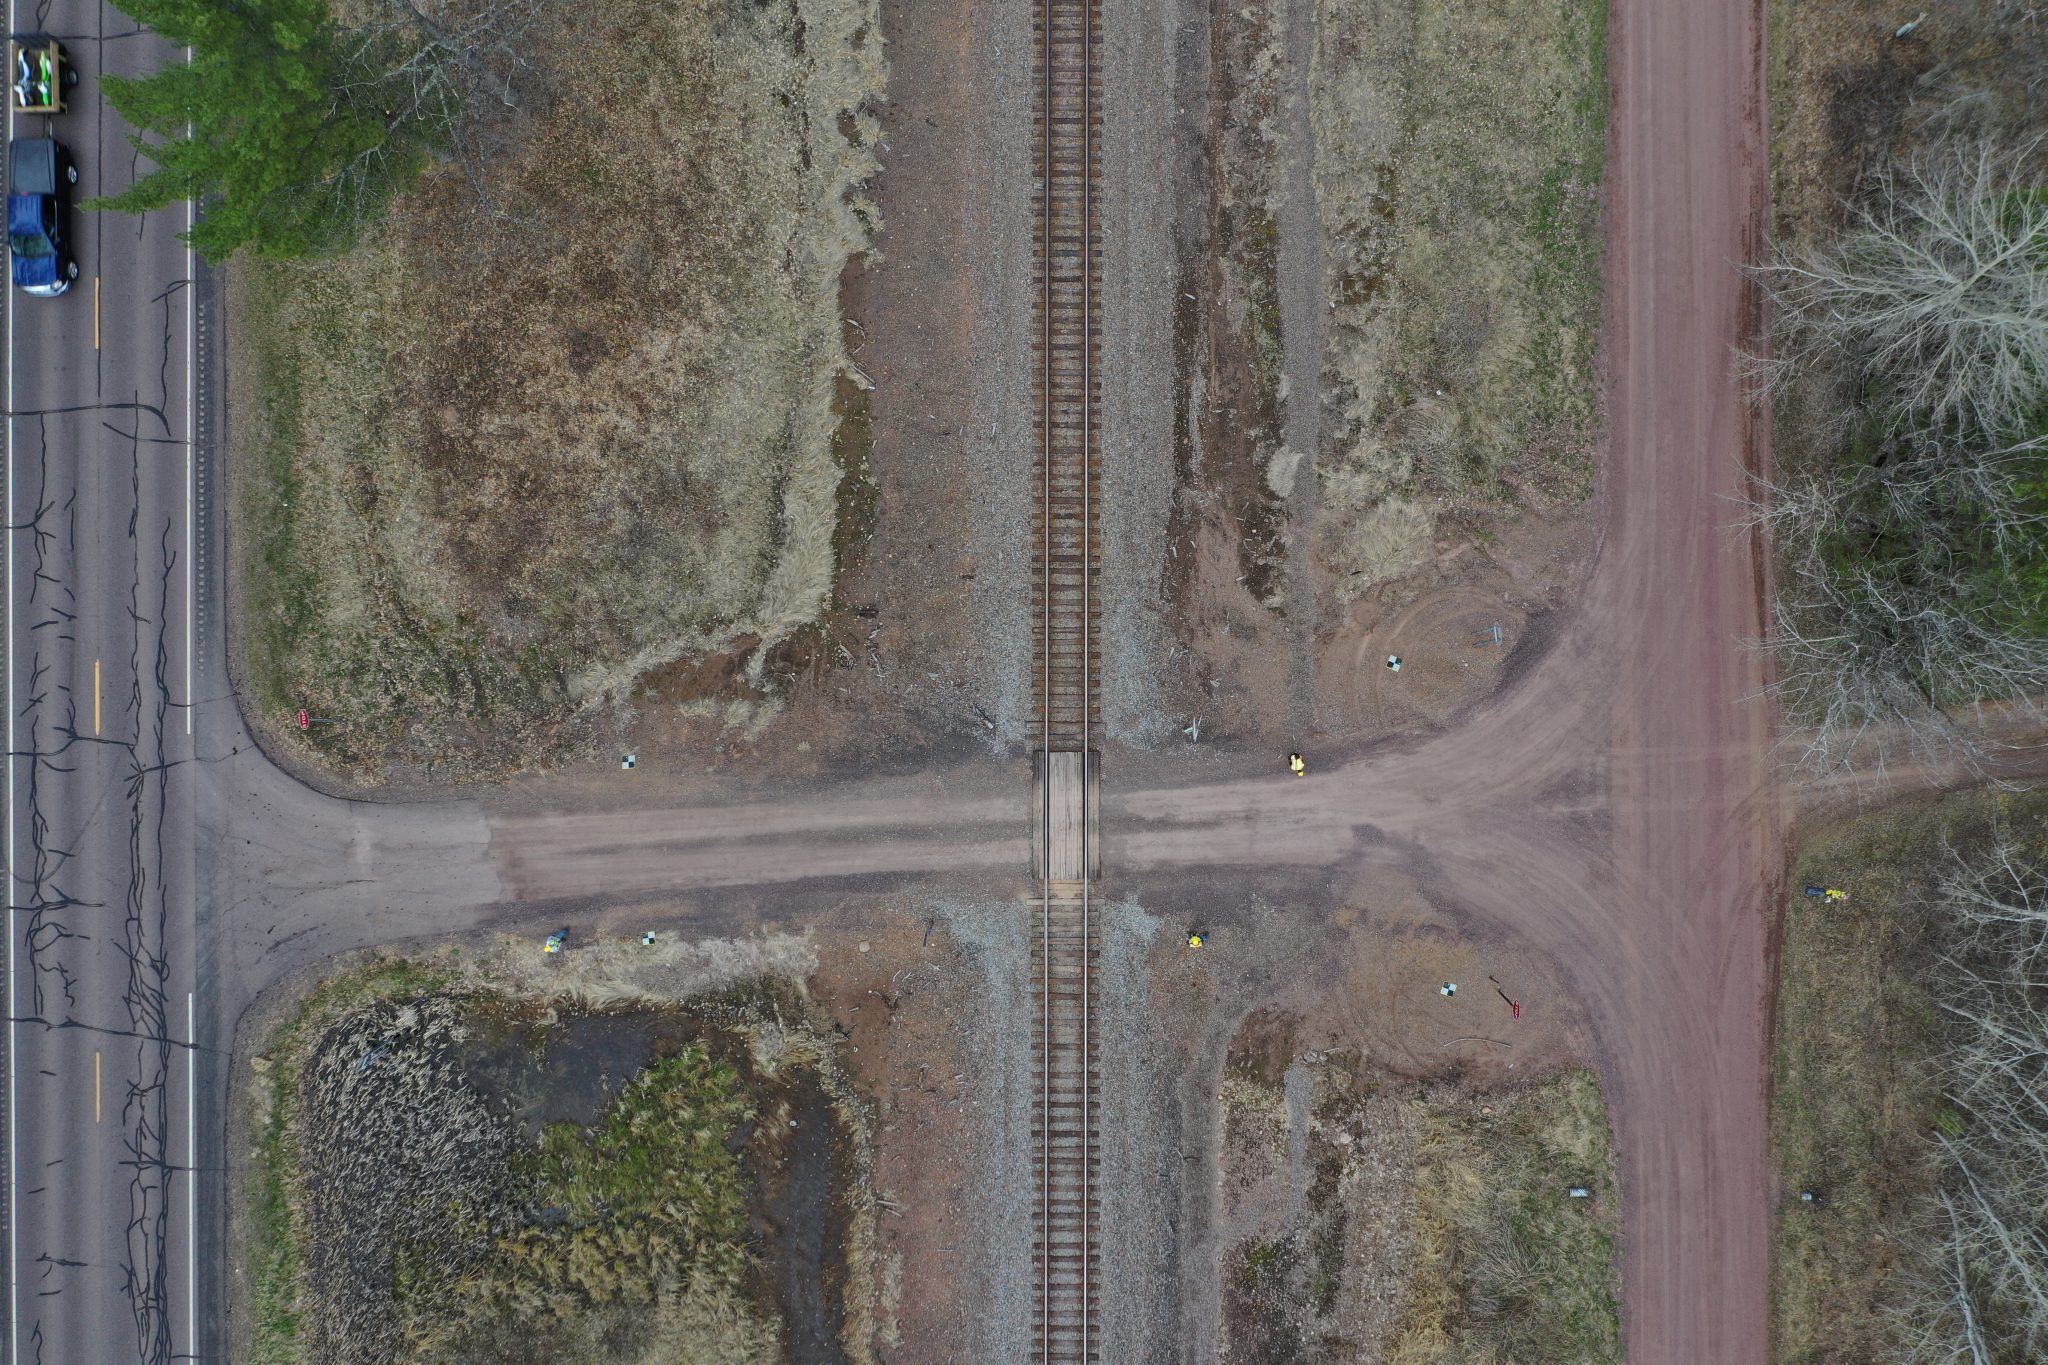
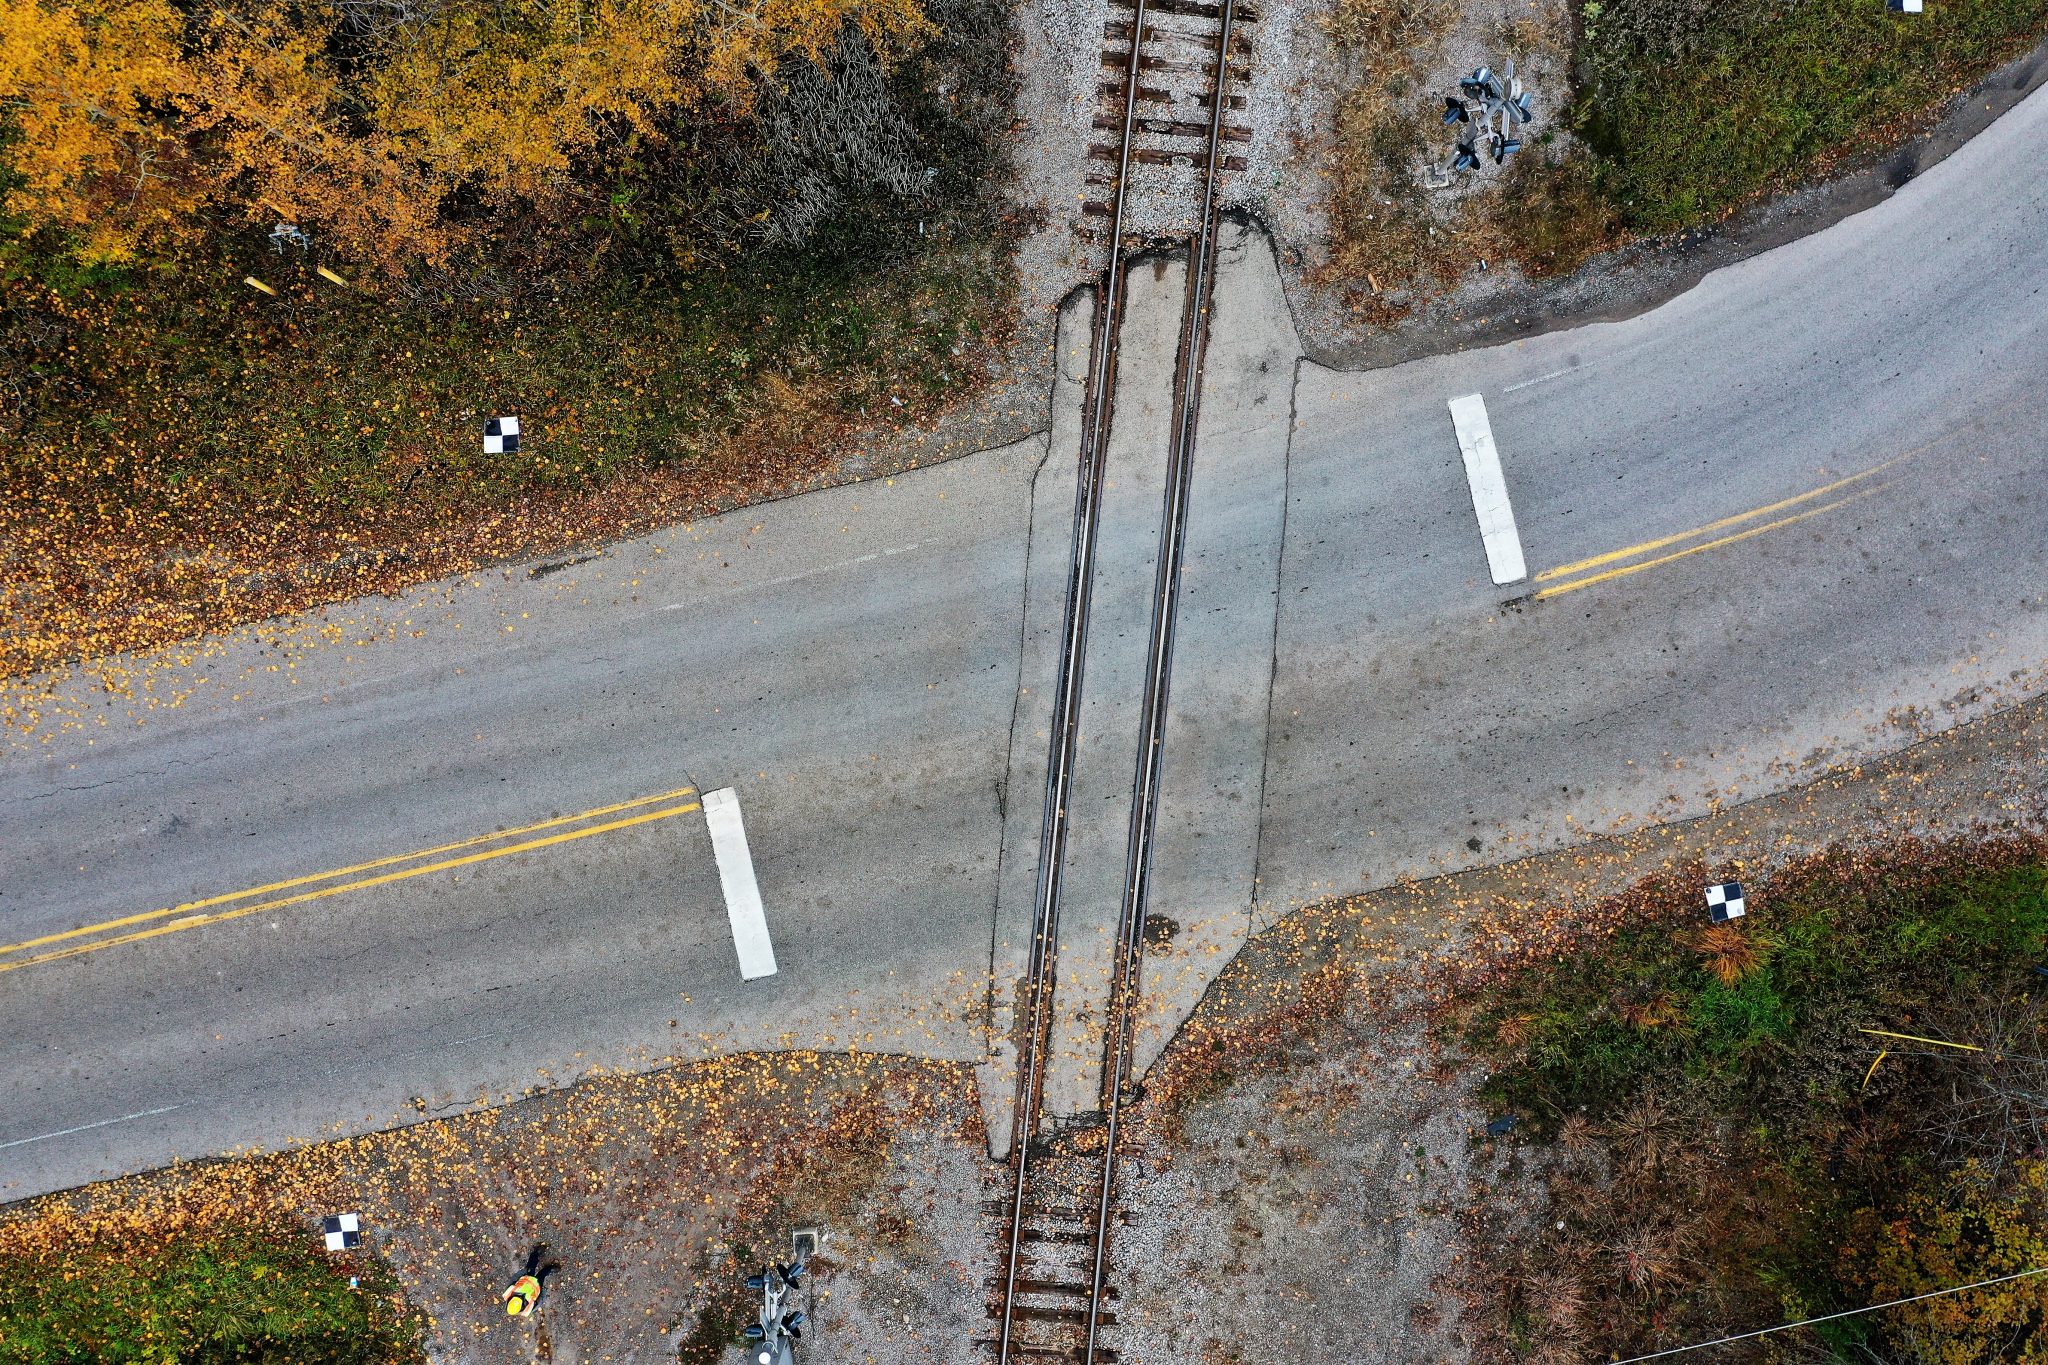
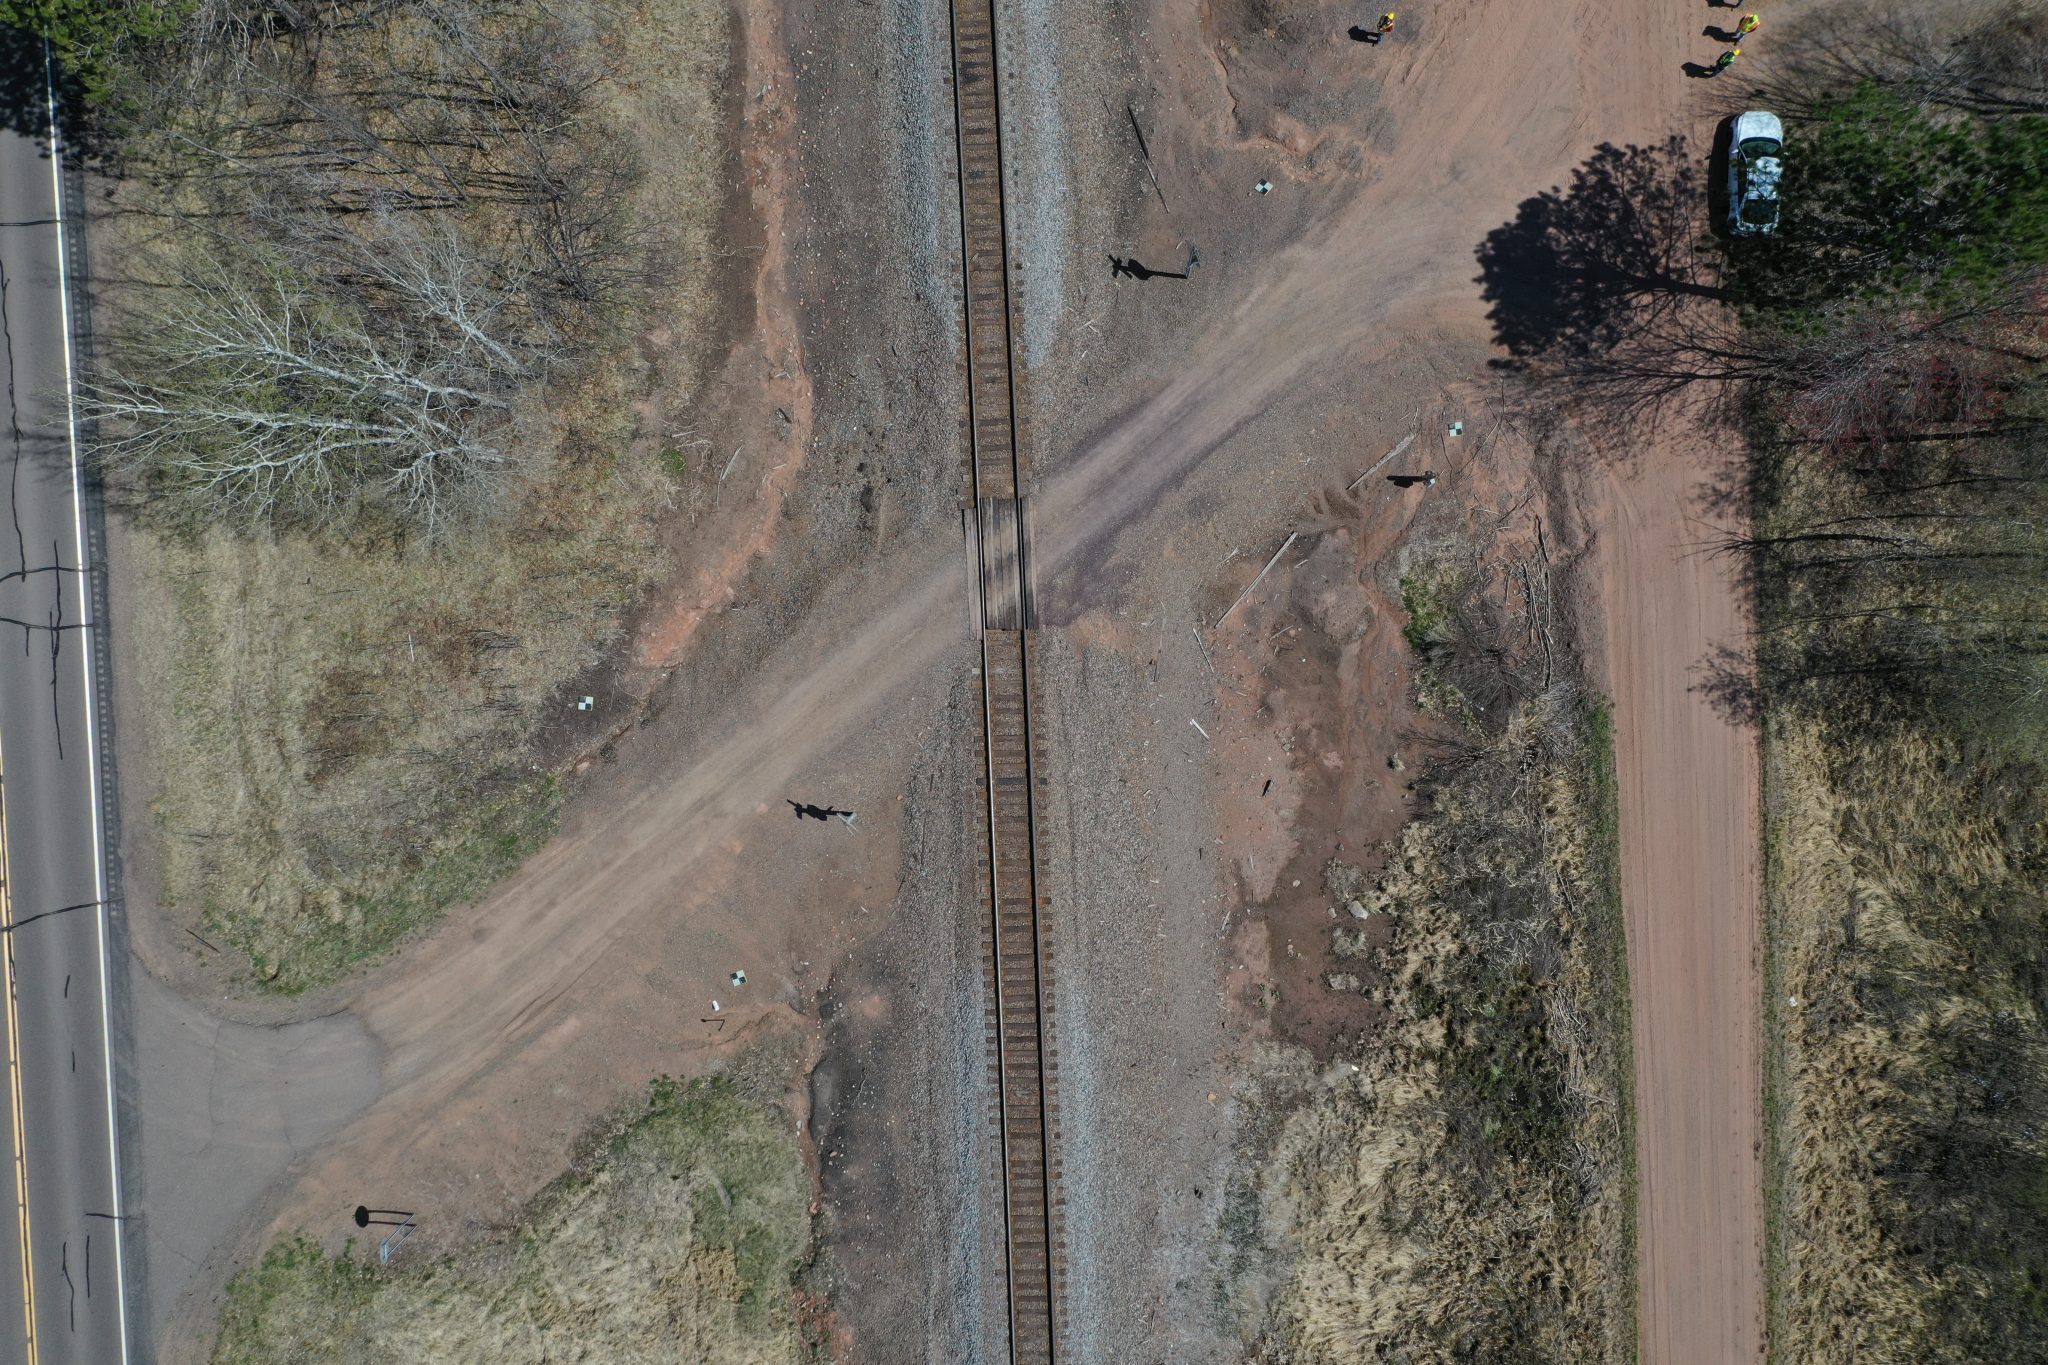
High-resolution drone-collected imagery of rail grade crossings.
Creating High Resolution 3D Models
High resolution imagery is collected from drones directly over the rail grade crossing for humped crossing analysis and over a larger area for visual sight line analysis. This high resolution imagery was processed into digital elevation models (DEMs) and orthoimagery of the rail grade crossings for vertical profile visual sight line assessment. DEMs are produced through 3D photogrammetry software and have a resolution of 0.4 inches (1 cm).
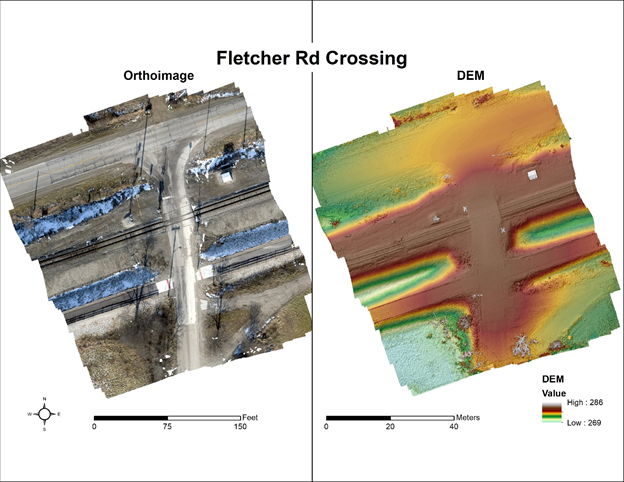
Example Orthoimages and DEMs:
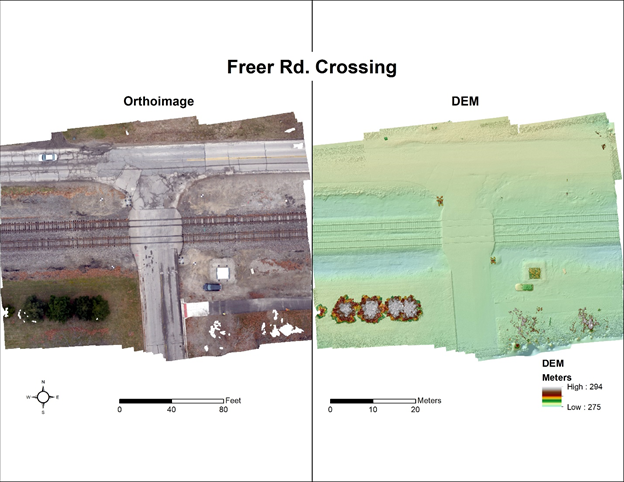
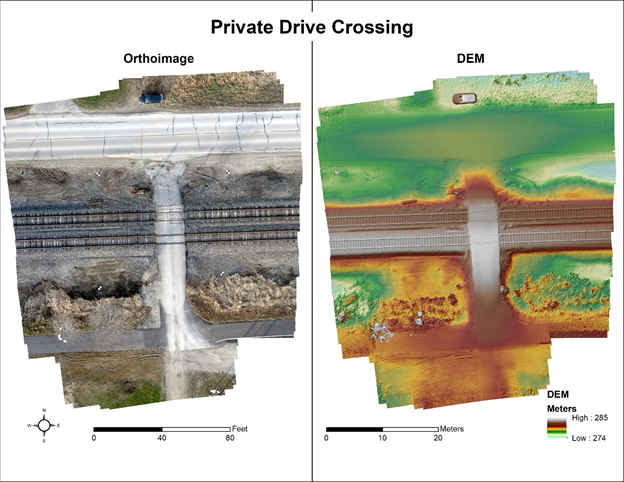
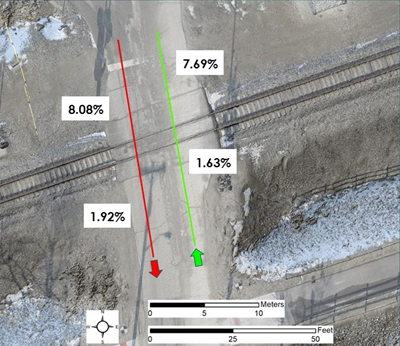
Crossing Slope and profiles can easily be generated from the high resolution DEMs. The slope on the northern portion of the rail grade crossing exceeds the crossing profile from the AASHTO guide “A Policy on Geometric Design and Streets” of a 0.89% max grade for 30ft from ends of ties.
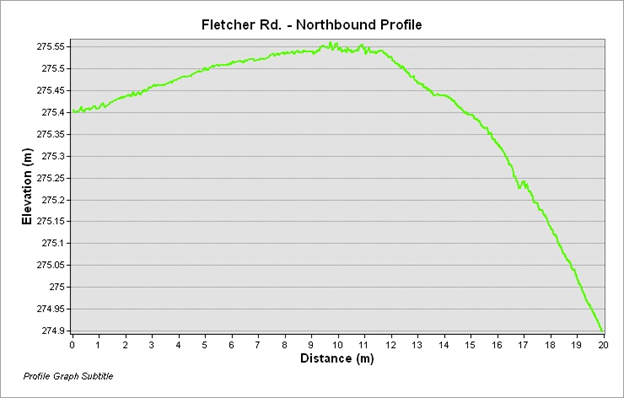
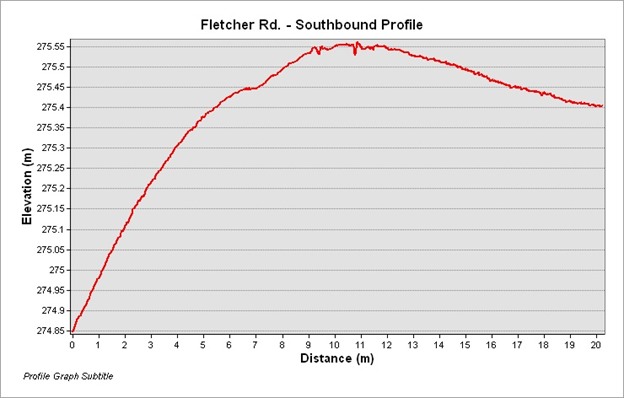
Profiles for northbound and southbound lanes along the rail grade crossing of Fletcher Rd. The northern side of the crossing is steeper than the southern side. Certain vehicle configurations could become stuck on the northern side of this crossing (Left image).
The Automated Profile Assessment Tool
Workflows were developed for both proposed automated tools. Both tools require the drone derived DEMs for rail grade crossing analysis. The Automated Profile Assessment Tool requires wheelbase and ground clearance for the vehicle being used in the analysis. Four vehicle types were used during the development and testing of the tool:
- a representative lowboy trailer with a wheelbase of 30 ft (9.1 m) and a ground clearance of 5 in (12.7 cm),
- a representative motorcoach with a wheelbase of 27 ft (8.2m) and a ground clearance of 7 in (17.8 cm),
- a 2020 Ford Explorer with a wheelbase of 10 ft (3.0m) and a 7.9 in (20.0 cm) ground clearance, and
- a representative school bus with a wheelbase of 23ft (7.0 m) and a 7 in (17.8 cm) ground clearance.
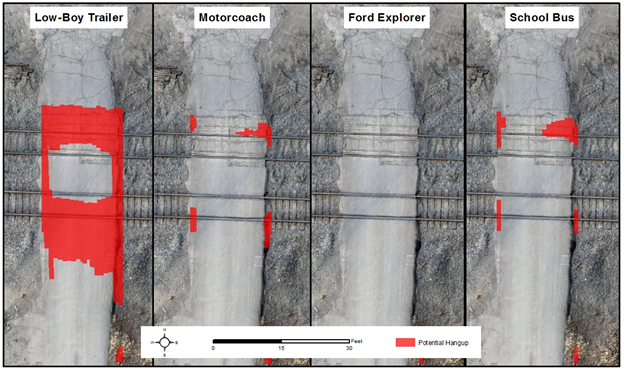
Additional vehicle types can also be assessed with this tool. The results of the Automated Profile Assessment Tool over a rail grade crossing with a humped crossing. The red polygon in each frame indicates where the bottom of the vehicle would strike the pavement. As indicated by the red shaded area, the representative lowboy trailer would encounter a hang-up situation on this rail grade crossing.
Results of the Automated Profile Assessment Tool for the private drive rail grade crossing. Areas marked by red polygons are locations where the bottom of the specified vehicle could strike the pavement and the vehicle could potentially become stuck on the crossing.
The Railroad Grade Crossing Viewshed Tool
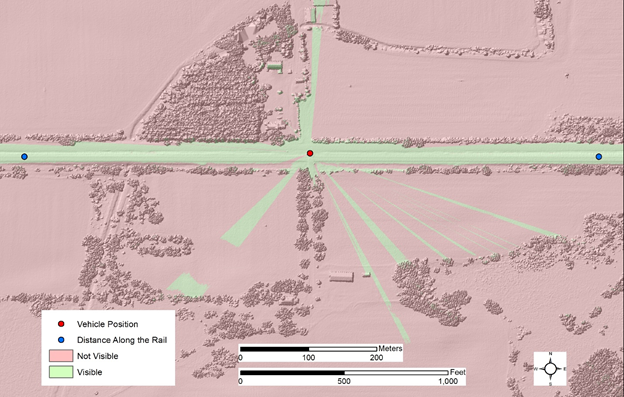
The Railroad Grade Crossing Viewshed Tool was used for analysis completed for visual sight lines. This tool uses the vehicle and train speeds to determine if a crossing has acceptable visual sight lines based on requirements defined in the AASHTO Green Book. The results of a visual sight lines analysis over a private drive crossing near Chelsea, MI using DEM data derived from drone-collected imagery. The areas highlighted in green would be visible by the vehicle stopped at the stop sign (represented by the blue dot). Areas highlighted in pink would not be visible to the driver.
Results of the Railroad Grade Crossing Viewshed Tool for the private drive crossing using drone imagery derived DEM. The blue point is the location of a vehicle at the stop sign at the crossing. Areas highlighted in green would be visible to the driver while pink areas are not.
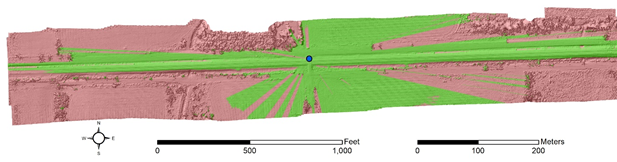
Both humped crossing and visual site line analysis can be performed using other high quality 3D data sets such as LiDAR point clouds. The following example is of a visual sight line analysis being performed on an aerial LiDAR point cloud collected by the USGS over Chelsea, MI.
Results of the Railroad Grade Crossing Viewshed Tool for the private drive crossing using LiDAR derived DEM. This demonstrates the ability of the tool to utilize any high quality 3D data source for analysis.
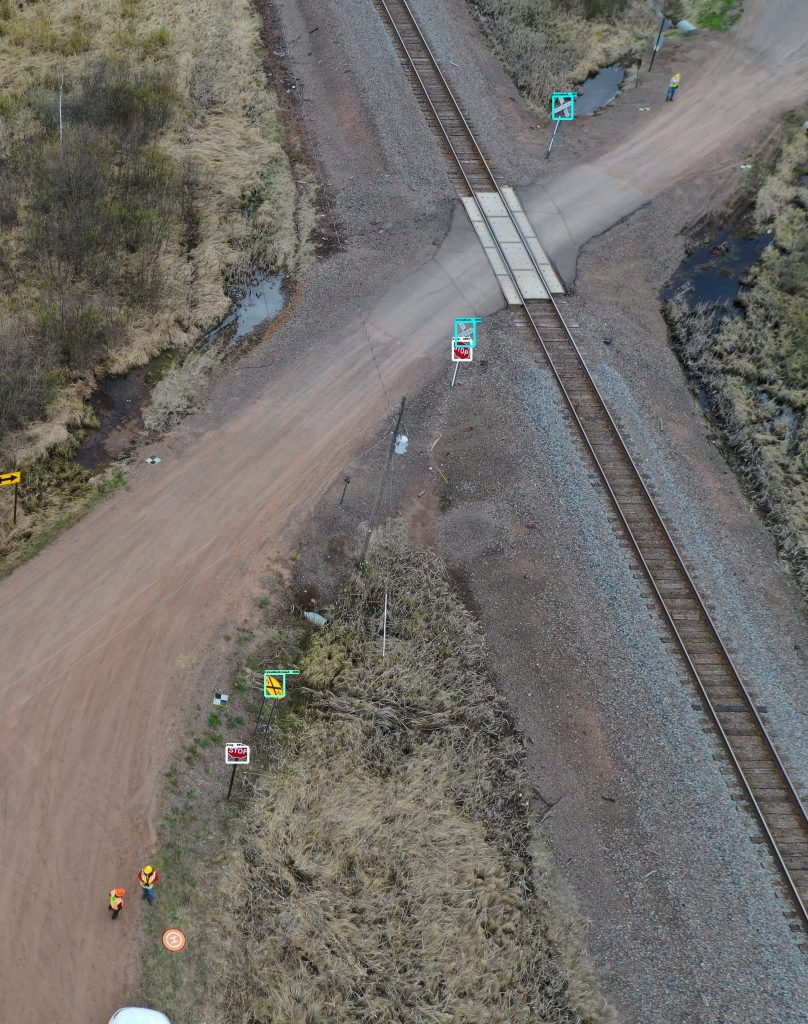
Oblique imagery collected by the DJI Mavic 2 Pro was processed through Mapillary to identify signs at a rail grade crossing. This figure is an example of an oblique image collected for sign identification. Signs that were identified by the software are outlined by a colored box.
Results of running a drone collected image through Mapillary for sign identification.
MTRI Inc. has been awarded and is currently working on Phase II of this SBIR to further develop the automated assessment of rail grade crossings. This will be completed with the help of State DOTs and Industry partners to tailor reporting to results to required reporting and needs.
References
(1) Federal Rail Administration. (2019). Safety Analysis Web Site. Retrieved from: https://safetydata.fra.dot.gov/OfficeofSafety/default.aspx
(2) National Transportation Safety Board. (2018). Rail Accident Reports. Retrieved from: https://www.ntsb.gov/investigations/AccidentReports/Pages/railroad.aspx
Principal Investigator
Co-Investigator

Colin Brooks, PhD
cbrooksmtriinc@gmail.com
734-604-4196

Richard Dobson
rdobsonmtriinc@gmail.com
734-913-6872