Decision Support System
Data/information
flow and decision support:
The purpose of this system is, rather than
overwhelm them in raw data, to present remote scour information to
bridge
owners in an easy to use, easy to understand format to aid in decision
making.
Coordination of the flow of data and information between the remote
sensing
system and the decision support client will be a major challenge. The
bulk of
data processing is embedded in the sensors themselves. The actionable
and
decision-enabling outputs that are produced from sensor hardware are:
flow or
no-flow (static versus dynamic) state of the sensor (or a sensor fault
condition detected), the channel bed profile, and the time-series of
scour
depth over a user-defined time period. In addition, user-defined
parameters and
thresholds will contribute even more to a rich, decision-making
workflow. An
example of added-value processes and products is the provision of
critical
scour depth alerts (e.g. an e-mail
or
application pop-up to notify decision makers about a recent critical
scour
depth measurement) based on user-defined thresholds. Another example
are report
templates, stored on the server, dynamically populated with up-to-date
bridge
information, and generated quickly upon request in a variety of formats
(e.g. Microsoft Word Document or
Adobe
PDF).
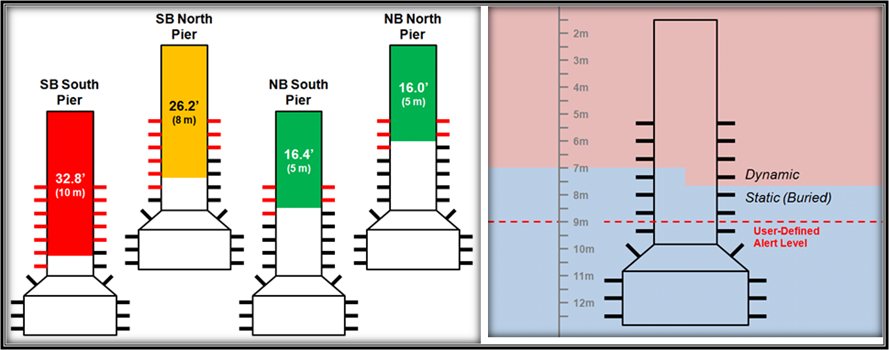
Sample
2D scour dept visualizations for a set
of bridge piers
The project team will work closely with its cost-share partners, the Michigan Departments of Transportation and Maryland State Highway Administration (MDSHA) as well as the TAC and survey respondents to develop visualization and analysis routines that best support decision makers, and establish sample intervals and alarm conditions. Flow or no-flow states can be visualized a variety of ways, such as the following figure, but some visualizations may be more meaningful than others. The project team will assess, for instance, whether visualizing the scour depth in three-dimensions around each bridge pier is necessary or useful for the decision maker or, as an alternative, it is more appropriate to view the average scour depth for each pier.
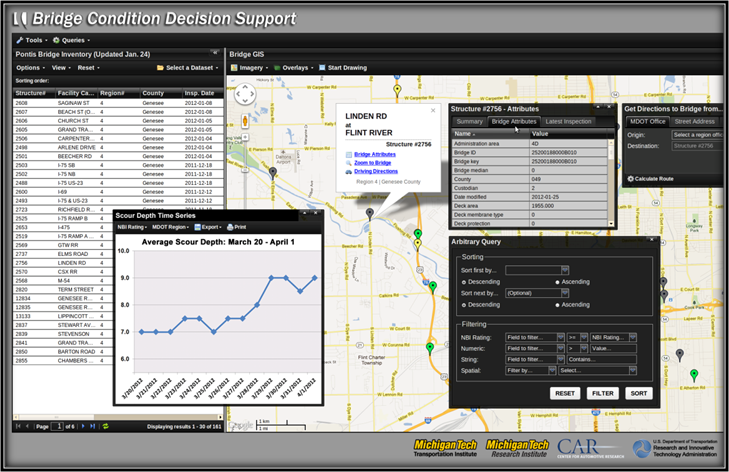
Modification to existing Bridge Condition DSS visualize to show scour information
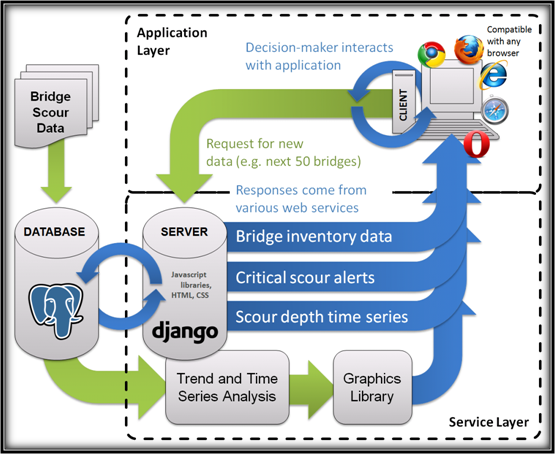
Software support framework for DSS engine
Provision of remote access is another important challenge. The Bridge Condition Decision Support System (DSS), developed under an existing contract with USDOT-RITA, already has the capabilities needed to support the visualizations described shown in the first succeeding figure. Developed entirely with open-source software, the DSS exposes bridge data for decision support through a series of web services hosted on an Apache server latter figure. The web services are programmed in Python using the Django web framework, a database application programming interface (API) that allows (among other things) for database queries to be parameterized and executed programmatically. The parameterization of queries is done in the application layer, on the client, by decision makers who, for instance, wish to look at the first 50 bridge records in the inventory sorted by structure number. Such a request is handled by the web server which delegates Django to construct a database query and return the desired results, encoded in Javascript Object Notation (JSON, a more compact alternative to XML), through one of the web services. The client application responsible for making these requests is a Javascript program, utilizing the ExtJS framework, which contains all the logic necessary to provide the decision-maker with an informative, user-friendly experience allowing data manipulation all on its own until more data are needed. The application also retains state; it remembers what the user has done in the same session so that, after filtering a table of bridge records, a subsequent sort operation returns only the filtered records.
To
support potentially sophisticated
structural views of bridge piers, channel profile views and other
visualizations, the DSS might be modified by the addition of a graphics
library
on the server. This library would be used to generate pre-rendered
decision-support visualizations based on up-to-date scour data. This is
in
contrast to the client-side graphics library for charting and plotting,
already
implemented in the DSS. In addition, temporal analysis routines stored
on the
server can be run to generate value-added bridge scour decision support
products such as rate of scour and time to a threshold scour depth.